
Home Bancorp (NASDAQ: HBCP) posted Q1 2026 diluted EPS of $1.45, beating the analyst consensus estimate of $1.39 by 4.32%. Net interest income reached $34.5 million, driving total revenue to approximately $38.2 million. The stock was trading near $64.68 ahead of the earnings release, with shares declining modestly in after-hours activity following the announcement.
About Home Bancorp, Inc.
Home Bancorp, Inc. (Nasdaq: HBCP) is a Lafayette, Louisiana-based bank holding company and the parent of Home Bank, N.A., a federally chartered national bank founded in 1908 as a mutual savings institution. The company officially became a publicly traded holding company in October 2008 upon Home Bank’s mutual-to-stock conversion. Home Bank operates full-service retail and commercial banking branches across Louisiana, Mississippi, and Texas, with the company recently expanding into Tomball, TX in March 2026.
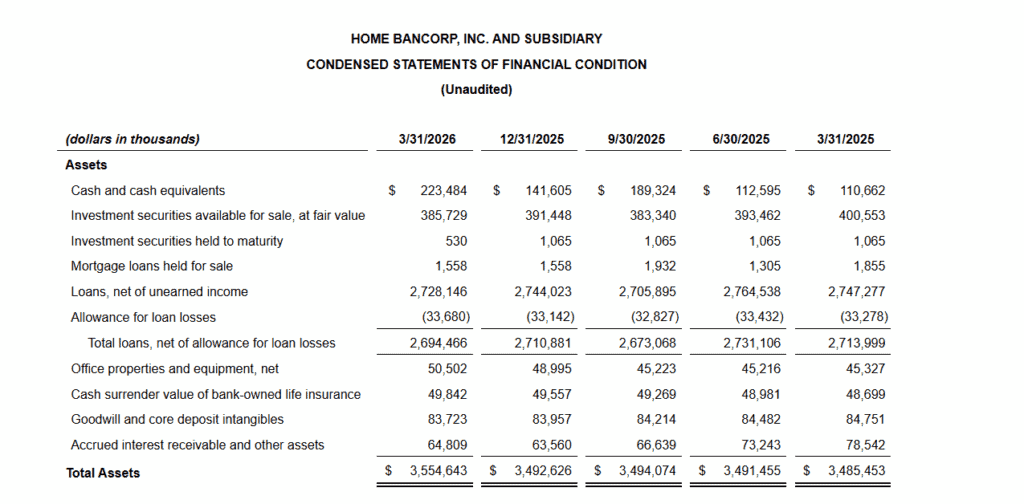
As of Q1 2026, Home Bancorp carries a market cap of approximately $500.82 million, placing it in the small-cap banking segment. The stock trades at a P/E ratio of approximately 11.05 with a quarterly dividend of $0.31 per share (annualized yield of approximately 1.9%). The company manages $3.55 billion in total assets, $2.73 billion in loans, and $3.03 billion in deposits. Home Bancorp has raised its dividend for 11 consecutive years, with 8% dividend growth over the past twelve months.
Top Financial Highlights
- Net income totaled $11.4 million for Q1 2026, essentially flat versus $11.4 million in Q4 2025
- Diluted EPS was $1.45, down marginally from $1.46 in Q4 2025 but up from $1.37 in Q1 2025
- Total interest income was $47.7 million; total interest expense was $13.3 million
- Net interest income rose to $34.5 million, up $434,000 (1%) from the prior quarter
- Net Interest Margin (NIM) expanded 10 basis points to 4.16% from 4.06% in Q4 2025 and 3.91% in Q1 2025
- Total deposits reached $3.03 billion, up $54 million (1.8%) from December 31, 2025; core deposits grew $118.1 million (22% annualized) to $2.3 billion
- Total loans stood at $2.73 billion, down $15.9 million (0.6%) from Q4 2025, reflecting softer loan production
- Noninterest income totaled $3.7 million, down $260,000 (7%) from Q4 2025
- Noninterest expense was $22.9 million, down $106,000 from Q4 2025
- Return on Assets (ROA) improved to 1.30% from 1.29% in Q4 2025
- Shareholders’ equity totaled $444.4 million; book value per share was $56.73 and tangible book value per share was $46.04
- Provision for loan losses was $922,000, up from $480,000 in Q4 2025
- Quarterly dividend declared at $0.31 per share, payable May 15, 2026
- Tier 1 leverage capital ratio at 12.11% and total risk-based capital ratio at 15.65%

Beat or Miss?
| Metric | Reported | Estimated | Difference / Analysis |
| Diluted EPS | $1.45 | $1.39 | Beat by 4.32% |
| Net Interest Income | $34.5 million | ~$33.40 million | Beat consensus estimate |
| Total Interest Income | $47.7 million | N/A | N/A |
| Net Income | $11.4 million | N/A | Essentially flat QoQ |
| NIM | 4.16% | N/A | 10 bps expansion QoQ |
| ROA | 1.30% | N/A | 1 bps improvement QoQ |
What Leadership Is Saying?
CEO John W. Bordelon on Strategy and Expansion:
“In March 2026, we opened our newest full-service location in Tomball, TX. We are pleased with our financial results for the first quarter. While loan production remained down during the quarter, deposit growth increased and reduced our loan to deposit ratio to 90%. Financial metrics remained strong with ROA increasing to 1.30% and a ten-basis point NIM expansion to 4.16% for the quarter. Credit metrics reflect an increase in nonperforming and criticized loans during the quarter, but we do not anticipate material losses. We remain focused on proactively identifying and resolving problem loans as quickly as possible. We are confident that our teams have the ability to broaden meaningful relationships with our customers across all our markets throughout the remainder of the year.”
CFO David T. Kirkley on Financial Outlook:
Management expects loan growth in 2026 to be in the “mid-single digits.” Kirkley projected: “We expect noninterest income to increase to between $3.8 million [per quarter].”
Historical Performance
Q1 2026 vs. Q1 2025 (YoY Comparison)
| Category | Q1 2026 | Q1 2025 | Change (%) |
| Total Interest Income | $47.74 million | $47.20 million | 1.10% |
| Net Interest Income | $34.48 million | $31.75 million | 8.60% |
| Total Noninterest Income | $3.74 million | $4.01 million | -6.70% |
| Total Noninterest Expense | $22.94 million | $21.58 million | 6.30% |
| Net Income | $11.36 million | $10.96 million | 3.60% |
| Diluted EPS | $1.45 | $1.37 | 5.80% |
| Net Interest Margin | 4.16% | 3.91% | +25 bps |
| Total Loans | $2.73 billion | $2.75 billion | -0.70% |
| Total Deposits | $3.03 billion | $2.83 billion | 7.10% |
| Total Assets | $3.55 billion | $3.49 billion | 2.00% |
Competitor Performance Comparison
Q1 2026 vs. Q1 2025
Home Bancorp competes primarily with regional and community banks of similar size. Its main competitors include CNB Financial (CCNE), Community Trust Bancorp (CTBI), First Financial Bancorp (FFBC), First Mid Bancshares (FMBH), Great Southern Bancorp (GSBC), and Byline Bancorp (BY)
| Category | HBCP Q1 2026 | HBCP Q1 2025 | Change (%) |
| Net Interest Margin | 4.16% | 3.91% | +25 bps |
| Return on Average Assets (ROA) | 1.30% | 1.29% | +1 bps |
| Return on Average Equity (ROE) | 10.41% | 11.02% | -61 bps |
| Efficiency Ratio | 60.02% | 60.35% | Improved 33 bps |
| Nonperforming Assets / Total Assets | 1.12% | 0.62% | +50 bps |
| Tier 1 Leverage Ratio | 12.11% | 11.48% | +63 bps |
| Tangible Book Value Per Share | $46.04 | $40.13 | 14.70% |
Competitor-specific Q1 2026 earnings data for CCNE, CTBI, FFBC, and GSBC were not yet publicly available at time of publication. The table above reflects Home Bancorp’s own performance trend, which serves as a benchmark relative to sector norms. Home Bancorp’s NIM of 4.16% and ROA of 1.30% compare favorably to small-cap community bank averages, while its efficiency ratio of 60.02% signals well-controlled overhead.
How the Market Reacted
Ahead of the Q1 2026 earnings release, HBCP shares closed at $64.68 on April 17, 2026, within striking distance of the stock’s 52-week high of $65.95. The stock had already gained over 10% in the prior month, outperforming the S&P 500’s 5.2% move over the same period.
Following the April 20 after-hours earnings release, data from OptionSlam indicated that HBCP shares declined approximately 3.3% the day after the earnings announcement, closing around $58.50. This modest pullback, despite a clean EPS beat, likely reflects profit-taking after the pre-earnings rally and investor concern over rising nonperforming assets, which climbed to 1.12% of total assets from 0.62% a year earlier. Market cap stood at approximately $500.82 million as of April 20, 2026