
S&P Global posted Q4 2025 adjusted EPS of $4.30 on revenue of $3.92B, with GAAP EPS at $3.75. Revenue slightly beat consensus, while EPS narrowly missed. Despite double‑digit earnings growth and margin expansion, the stock fell roughly 6% to about $418 in early trading after the release, reflecting concern over 2026 guidance and valuation.
About S&P Global
S&P Global Inc. (NYSE: SPGI) is a leading provider of credit ratings, benchmarks, indices, and data/analytics that underpin global capital and commodity markets. Founded in 1860 and headquartered in New York, the company operates through five main divisions: Market Intelligence, Ratings, Commodity Insights (Energy), Mobility, and S&P Dow Jones Indices.
As of early February 2026, S&P Global commands a market capitalization of roughly $130–140B (around $133B on February 6, 2026), positioning it among the world’s largest financial information providers. The stock trades at a trailing price-to-earnings (P/E) multiple of approximately 32.3x, with a forward P/E just under 23x, reflecting expectations of continued double-digit EPS growth. S&P Global has increased its dividend for more than five decades; its annual dividend is $3.88 per share, implying a yield of approximately 0.9%, and it employs approximately 42,350 people worldwide. The business generates high profitability, with a trailing gross margin of approximately 69.8% and an adjusted operating margin of approximately 50%, underscoring the scalability of its data and index franchises.
Top Financial Highlights
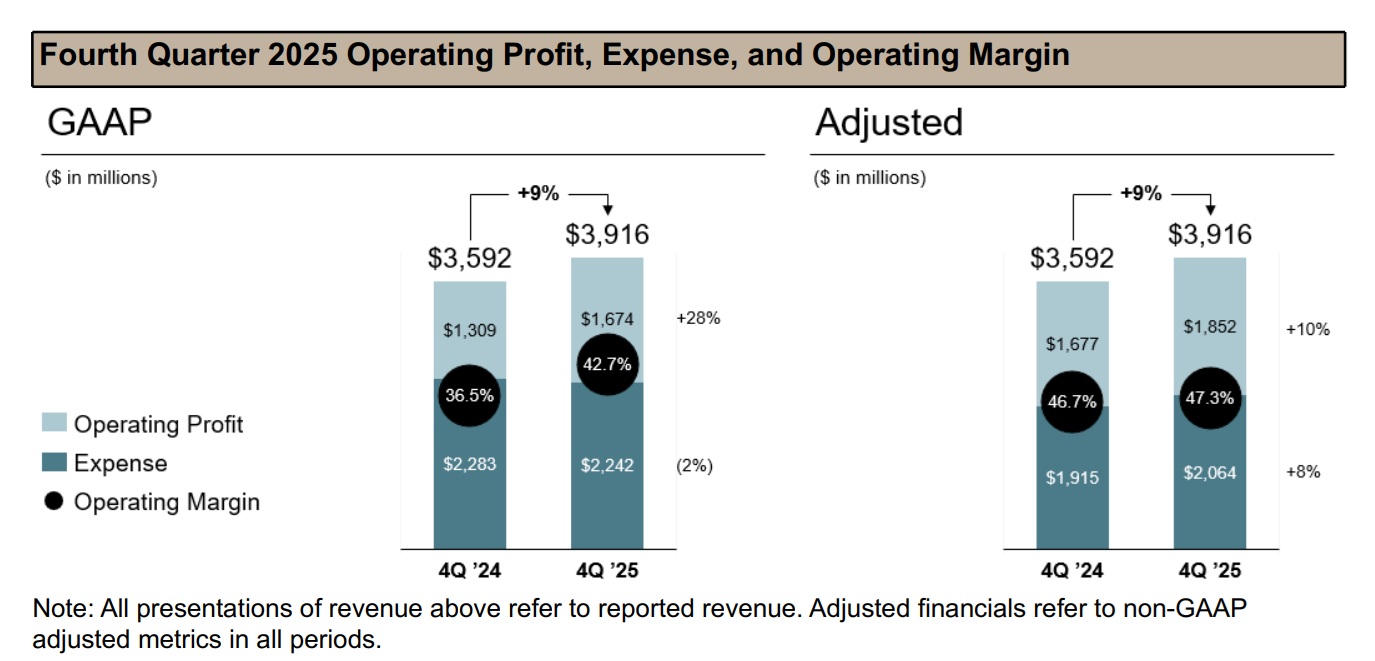
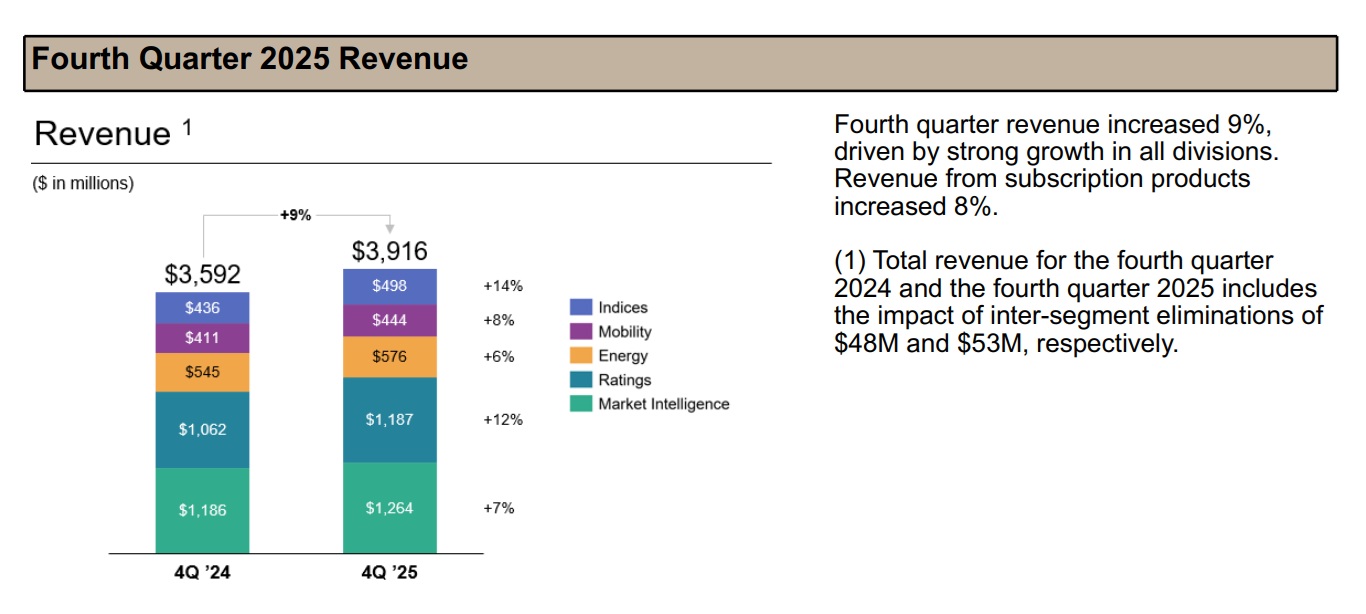
- Total Q4 2025 revenue was $3.916B, up 9% year over year, compared with about $3.59B in Q4 2024, driven by broad‑based growth across all five operating divisions.
- Q4 2025 GAAP net income rose 29% to $1.134B, reflecting strong operating leverage, especially in the Ratings and Indices businesses.
- Q4 2025 GAAP diluted EPS increased 32% to $3.75 per share, supported by higher net income and a modest 2% reduction in diluted share count.
- Q4 2025 adjusted net income reached $1.299B, up 12% year over year, with adjusted diluted EPS of $4.30, a 14% increase versus $3.77 a year earlier.
- Q4 adjusted operating profit came in at $1.90B, up 12%, yielding an adjusted operating margin of 47.3%, up 60 bps year over year, highlighting strong profitability even as the company continues to invest in AI and private markets.
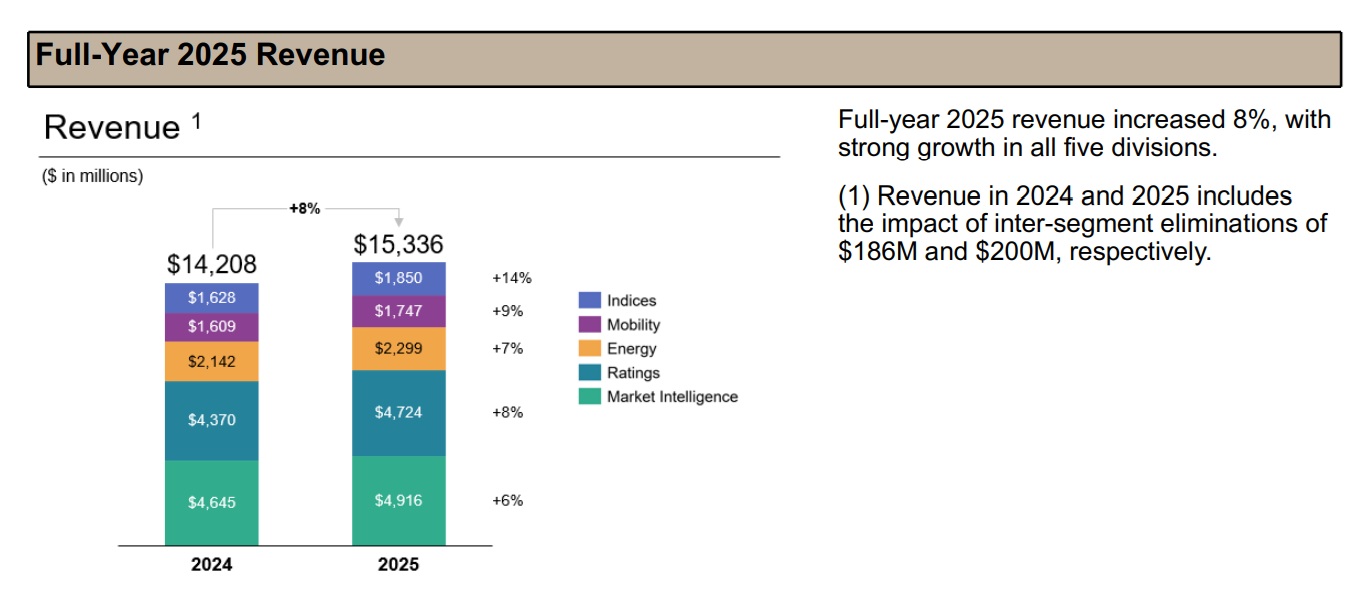
- Full‑year 2025 revenue was approximately $15.34B, representing 8% year‑over‑year growth, with “strong growth in all five divisions,” according to management.
- Full‑year 2025 GAAP diluted EPS was $14.66, up 19% versus 2024, while adjusted diluted EPS was $17.83, up 14%, reflecting robust operating performance and share repurchases.
- Full‑year GAAP operating margin improved by about 3 percentage points to 42.2%, and adjusted operating margin expanded 140 bps to 50.4%, driven by revenue growth and efficiency gains across Ratings, Indices, and Market Intelligence.
- Segment Q4 revenues: Market Intelligence $1.26B (+7%), Ratings $1.19B (+12%), Energy $576M (+6%), Mobility $444M (+8%), and Indices $498M (+14%), underscoring broad‑based momentum.
- Cash and liquidity: S&P Global exited Q4 2025 with $1.75B in cash, cash equivalents and restricted cash, versus $1.67B a year earlier; long‑term debt stood at about $12.37B, up from $11.39B.
- Cash flow and capital returns: The company generated roughly $5.65B in cash from operating activities and $1.62B in free cash flow, and returned $6.2B to shareholders in 2025, including $1.2B in dividends and $5.0B in share repurchases.
- 2026 guidance: Management guided to adjusted EPS of $19.40–$19.65, implying mid‑teens growth, with organic, constant‑currency revenue growth of 6–8%, GAAP revenue growth of 6.6–8.6%, corporate unallocated expense of $220–230M, capex of $215–225M, and a 22–23% effective tax rate.
- Profitability profile: On a trailing basis, S&P Global maintains a gross margin near 70% and an adjusted operating margin above 50%, placing it among the most profitable large‑cap financial information providers.
Beat or Miss?
Performance vs Expectations
| Metric | Reported | Difference / Analysis |
| Revenue (Q4 2025) | $3.92B | Slightly beat consensus of about $3.89B, a positive surprise of roughly +0.5%. |
| Adjusted EPS (Q4 2025) | $4.30 | Missed consensus of $4.32 by about 0.5%, despite 14% YoY growth. |
| GAAP EPS (Q4 2025) | $3.75 | No widely cited consensus; GAAP EPS rose 32% YoY, showing strong underlying leverage. |
| Adjusted operating margin | 47.30% | Expanded 60 bps YoY; consensus not disclosed, but margin remains best‑in‑class. |
Overall, S&P Global beat on revenue but slightly missed on adjusted EPS, with robust margin expansion. The market appears to be focusing more on the forward guidance and valuation than on the small EPS miss.
What Leadership Is Saying?
“We delivered a strong quarter driven by performance in all divisions, momentum in private markets, and expansion with our CCO clients. I’m very proud of what we accomplished in 2025. We outlined our new mission of Advancing Essential Intelligence, and our medium-term strategy designed to drive durable, profitable growth… Our strategy, coupled with the resilience of our business model, and favorable secular and cyclical tailwinds, position us well to deliver the vision and financial targets we established at our Investor Day in November.” — Martina Cheung, President and CEO
“Our business really is about adding more and more data and in particular proprietary enhanced data every year.” — Eric Aboaf, Chief Financial Officer
Cheung’s remarks emphasize the strategic framework—Advancing Essential Intelligence, AI integration, and private markets expansion—behind the strong 2025 results. Aboaf’s commentary highlights the company’s margin and growth engine: scaling proprietary data and analytics on a largely fixed-cost base.
Historical Performance
YoY Comparison – S&P Global (Q4 2025 vs Q4 2024)
| Category | Q4 2025 | Q4 2024 | Change (%) |
| Revenue | $3.92B | $3.59B | 9% |
| GAAP net income | $1.13B | ~$0.88B | +29% (as disclosed) |
| Adjusted diluted EPS | $4.30 | $3.77 | 14% |
- Revenue grew 9%, with all divisions contributing, notably double‑digit growth in Ratings and Indices.
- GAAP net income increased 29%, implying prior‑year Q4 net income of roughly $0.88B, consistent with company‑reported growth rates.
- Adjusted diluted EPS advanced 14%, from $3.77 to $4.30, showing that earnings are growing faster than revenue due to operating leverage and buybacks.
Historical Performance – Competitor
Below is a simplified revenue‑focused comparison of S&P Global and key peers, using each company’s most recent reported fourth quarter versus the same quarter a year earlier.
| Category | Q4 (Current) Revenue | Q4 (Previous Year) Revenue | Change (%) |
| S&P Global revenue | $3.92B | $3.59B | 9% |
| Moody’s revenue | $1.67B | ~$1.48B | +13% |
| MSCI revenue | $822.5M | $743.5M | 10.60% |
| ICE net revenue | $2.50B | ~$2.32B | 8% |
All four players are posting high single‑ to low double‑digit revenue growth, with S&P Global’s +9% slotting in the middle of the peer range. Moody’s and MSCI are showing slightly faster top‑line growth, while ICE is modestly slower but still robust. S&P Global, however, distinguishes itself with very high adjusted operating margins (~50%) and a diversified mix across ratings, indices, and data/analytics.
How the Market Reacted?
Despite solid Q4 and full‑year 2025 results—including 8% full‑year revenue growth, expanding margins, and double‑digit EPS growth—investors reacted negatively. Shares of S&P Global fell about 5.9% following the earnings announcement, trading near $417.99 and erasing roughly $8.4B in market value. Pre‑market indications indicated even steeper selling, with some sources citing intraday declines of over 15% as investors digested the 2026 guidance and valuation reset.
The sentiment around the report appears cautiously bearish in the short term: revenue outperformance and strong margins were overshadowed by concerns that 2026 EPS guidance, while strong in absolute terms ($19.40–$19.65), might not fully justify the prior premium multiple. Over the medium term, however, the combination of durable mid‑single‑digit to high‑single‑digit revenue growth, 50%‑plus adjusted margins, and aggressive capital returns continues to support a constructive fundamental story for long‑term holders.