
Introduction
Email Statistics: Email is an online communication platform for sending and receiving messages via internet-connected devices. In 2026, more than 4.73 billion users will be using email addresses to create online accounts, receive alerts, and stay in touch for work or business at any time, from any place. It also enables the rapid sharing of information, files, and updates. Email is widely used across sectors such as business, education, healthcare, government, banking, retail, marketing, IT, media, hospitality, and customer service.
This article presents several statistical analyses and insights that will help effectively understand email usage patterns and provide guidance.
Editor’s Choice
- According to debounce.com, the global number of emails is projected to reach 4,730 million by 2026, up from 4,894 million in 2025.
- Gmail is the most used mailbox provider, with 72.1% of users receiving emails in 2025.
- Email usage worldwide continues to grow, with global users expected to reach 4.73 billion by 2026.
- 87% of marketing leaders reported that email marketing was essential to company success.
- Email is a daily habit for 99% users, and some check up to 20 times a day.
- In 2024, the United States sent 9.7 billion emails, followed by Germany (8.5 billion) and Ireland (8.4 billion).
- Email was used by people aged 16 to 24, accounting for 75.6%.
- The average email open rate is 36.5% across industries.
- In the United States, 43% of people reported that they often or always delete brand emails without reading them.
- As of 2025, the total number of emails sent and received reached around 376.4 billion, up from 361.6 billion in 2024.
- In 2025, global email traffic reached 376.4 billion emails per day, an increase of 4%.
- By 2026, global email marketing revenue is estimated to reach approximately USD 15.81 billion, up from USD 13.69 billion in 2025.
- In North America, the average email click-through rate is 4.77%, while the world average is 3.25%.
- In 2025, approximately 241 million spam emails are sent per minute, accounting for 45.6% of traffic.
Email Users Statistics
- According to debounce.com, the global number of emails is projected to reach 4,730 million by 2026, up from 4,894 million in 2025.
- The number is expected to reach 4,730 million by 2027 and 4,894 million by 2028.
Global Emails Per Day Statistics

(Source: imagekit.io)
- As of 2025, the total number of emails sent and received per day reached approximately 376.4 billion.
- Global email volume is expected to reach 392.5 billion by 2026 and 408.2 billion by 2027.
Popular Mailbox Providers For Receiving Emails

(Reference: imagekit.io)
- The above graphical analysis shows that Gmail is the most used mailbox provider, with 72.1% of users receiving emails in 2025.
- Meanwhile, Outlook is next at 33.7%, followed by Yahoo Mail (20.3%), Apple Mail (7.4%), GMX (5.6%), Web.de (5.3%), AOL (4.8%), Orange (4.6%), and both Samsung Email and SFR (2.2% each).
- Meanwhile, other providers together will account for 6.7%.
Email Usage Statistics
- According to porchgroupmedia.com, email usage worldwide continues to grow, with global users expected to reach 4.73 billion by 2026.
- More than 3.13 million emails are sent per second, and approximately 376.4 billion are sent and received each day.
- Gmail is the most widely used email service, with approximately 1.8 billion users.
- The average person maintains at least 1.86 email accounts and receives approximately 100-120 emails per day.
- Email is a daily habit for 99% of users, and some check up to 20 times a day.
- People spent 10 seconds on brand emails, and 58% checked their email before news or social media.
- Around 69% checked email while watching TV, 57% in bed, and 79% on vacation.
- A report by Shopify further stated that 87% of marketing leaders reported that email marketing was essential to company success.
- Approximately 1 in 3 marketers reported using email marketing.
- 44% of marketing professionals identified email as the top channel, while social media and paid search were tied for second at 16% each.
- Additionally, 63% of email marketers reported sending more marketing emails over time.
By Country
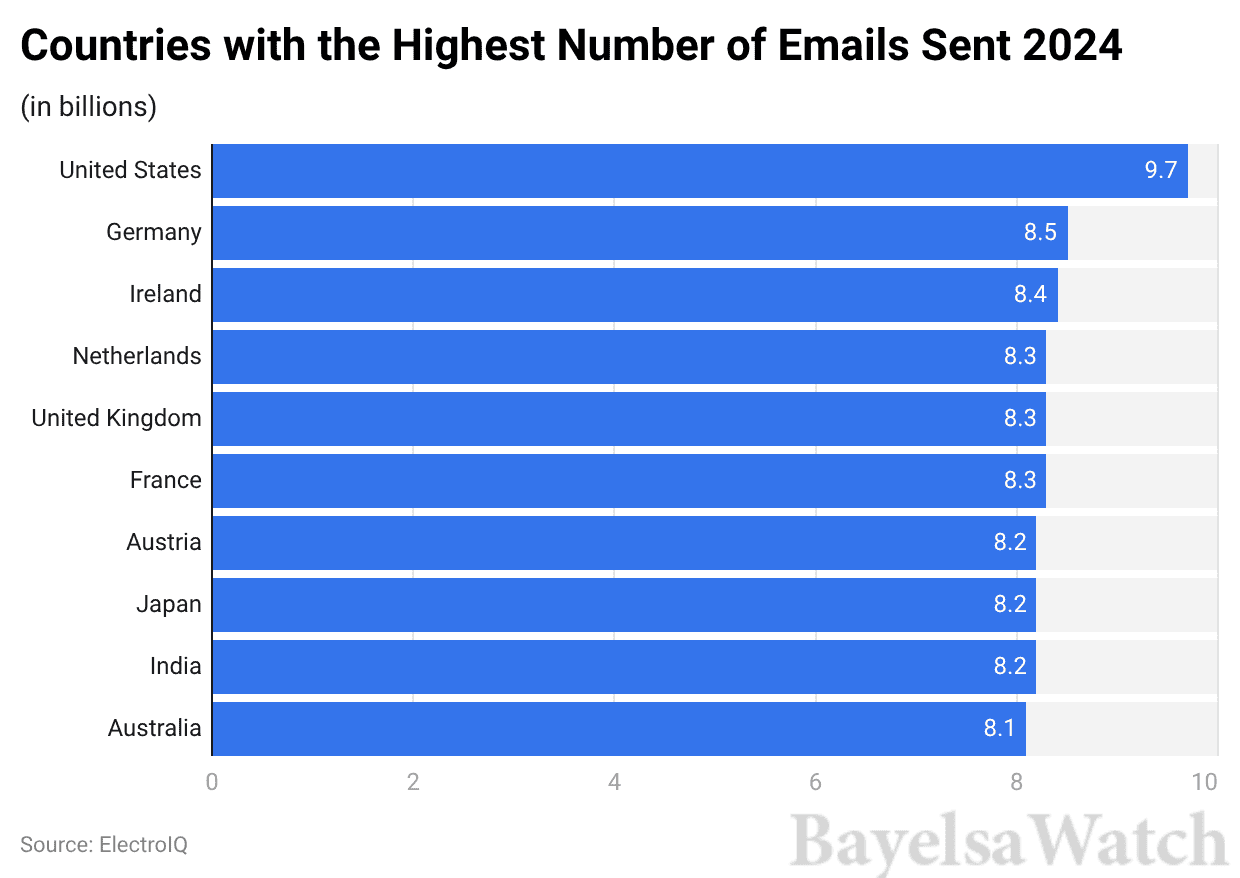
(Reference: imagekit.io)
- In 2024, the United States sent 9.7 billion emails, followed by Germany (8.5 billion) and Ireland (8.4 billion).
- Followed by the Netherlands (8.3 billion), the United Kingdom (8.3 billion), France (8.3 billion), Austria (8.2 billion), Japan (8.2 billion), India (8.2 billion), and Australia (8.1 billion).
By Demographics
- Email was used by people aged 16 to 24, accounting for 75.6%.
Other age group usage share is mentioned below:
| Age Group (Year) | Share |
| 16-24 | 75.6% |
| 25-34 | 74.9% |
| 35-44 | 74.0% |
| 45-54 | 73.9% |
| 55-64 | 73.2% |
| 65 and above | 83.9% |
Email Engagement Statistics
- According to Shopify.com, the average email open rate is 36.5% across industries.
- In the United States, 43% of people reported that they often or always delete brand emails without reading them, whereas only 29% reported that they seldom or never do so.
- Retail companies achieved an open rate of 33.1%.
- Email opens typically occur shortly after sending, with about 21.2% occurring within the first hour.
- Based on performance, weekly newsletters perform best, averaging an open rate of 48.31% and a click-through rate (CTR) of 5.71%.
- Technology and transportation had the highest CTRs at 2.6%, compared with the 1.4% average CTR across industries.
Email Volume Analyses

(Reference: porchgroupmedia.com)
- In 2025, the total number of emails sent and received reached around 376.4 billion, up from 361.6 billion in 2024.
- The total number of email messages in previous years was followed by 2023 (347.3 billion), 2022 (333.2 billion), 2021 (319.6 billion), 2020 (306.4 billion), 2019 (293.6 billion), 2018 (281.1 billion), and 2017 (269 billion).
Daily Email Traffic Statistics
- In 2025, global email traffic reached 376.4 billion emails per day, an increase of 4%.
Other analyses are stated in the table below:
| Year | Total worldwide emails per day (billion) | Change rate |
| 2024 | 361.6 | 4% |
| 2023 | 347.3 | |
| 2022 | 333.2 | |
| 2021 | 319 |
Email Check Frequency Statistics

(Source: optinmonster.com)
- In 2024, approximately 39% of users checked their email three to five times per day.
- Moreover, 27% check email 10-20 times a day, followed by 22% (more than 20 times), 8.5% (once daily), and 3.5% (don’t check every day).
Email Marketing Statistics
- According to OptinMonster’s analysis, in 2025, nearly 4.5 billion people worldwide used email, and forecasts indicate this will exceed 4.8 billion by 2027.
- Around 88% checked email multiple times daily, and 39% check 3-5 times.
- If an email isn’t mobile-friendly, 50% will delete it. Automated emails bring 320% more revenue.
- Every USD 1 spent yields approximately USD 36 (360% ROI).
- Additionally, 59% of consumers report that marketing emails influence their purchasing decisions.
By Revenue

(Reference: statista.com)
- By 2026, global email marketing revenue is estimated to reach approximately USD 15.81 billion, up from USD 13.69 billion in 2025.
- Meanwhile, the previous year’s revenue was USD 12.33 billion in 2024, USD 10.89 billion in 2023, USD 9.62 billion in 2022, USD 8.49 billion in 2021, and USD 7.5 billion in 2020.
By ROI
- By 2026, email marketing is expected to return about USD 42 for every USD 1 spent, and 18% of companies report earning more than USD 70 per USD 1 invested.
- Meanwhile, email marketing accounted for approximately 25% of total company revenue.
- The median ROI was 122%, approximately 4 times that of other digital channels.
- Shoppers who buy through email promotions spend 138% more than people who don’t receive email offers.
- 89% of marketers report that email is their primary lead-generation channel, and 79% rank it among their top three channels.
- Email influences purchases for nearly 6 in 10 subscribers.
- Moreover, 50.7% purchase from a marketing email at least monthly, 23.8% buy several times a month, and 3% buy more than once weekly.
- Segmented lists can lift email revenue by 760%.
By Industry (October 2024)
| Industry | Open Rate | Click Rate | Bounce Rate |
| Technology Services | 26.80% | 2.65% | 12.50% |
| Retail | 33.80% | 1.11% | 8.81% |
| Dining & Food Services | 32.54% | 0.81% | 8.78% |
| Real Estate | 33.75% | 1.31% | 13.84% |
| Education | 39.50% | 2.33% | 9.32% |
Mobile Email Marketing Statistics
- Mobile optimisation is critical, with 50% of people deleting emails that don’t look right on mobile.
- In 2025, email opens were roughly 42% on mobile apps, 39.8% on webmail/web apps, and 18.2% on desktop apps.
- Kinsta® Industry benchmarks also indicate that mobile typically accounts for 50-65% of opens.
- If a reader opens an email on a mobile device and later reopens it on a desktop, they are 65% more likely to click.
- In November 2025, Litmus lists stated the top clients as Apple (47.8%), Gmail (25.29%), Outlook (3.67%), Yahoo Mail (2.16%), and Google Android (1.22%).
Email Subject Line and Open-Rate Analyses
- Backlinko’s analysis reports an average email open rate across industries of 35.63%.
- Welcome emails perform far better, with an 83.63% open rate.
- Strong campaigns often use subject lines around 44 characters.
- Emails built around images tend to get more opens (43.12%) than text-only emails (35.79%).
- In iPhone Mail, only the first 48 characters of a subject line are displayed, whereas Gmail displays about 37.
- Emoji subjects are close: 37.5% vs 42.23%.
Email Clickthrough Rate Statistics
- In North America, the average email click-through rate is 4.77%, while the world average is 3.25%.
- Some sectors exceed the global average, including Legal Services (12.11%), Communications (8.66%), and Technology & High Tech (7.4%).
- One weekly newsletter receives 5.71% clicks; two and three drop to 4.73% and 3.73%, respectively.
- Personalising the body now hurts, dropping clicks from 4.45% to 3.18%.
- Welcome emails deliver 5.1 times more clicks, and video emails convert at 5.25%.
Email Spam Statistics
- Debounce’s 2025 report projects that 376.4 billion emails will be sent/received daily by 4.6 billion users.
- About 84.9% check inboxes at least twice daily.
- Approximately 241 million emails are sent per minute, and spam accounts for 45.6% of traffic.
- China and the U.S. are the leading sources of spam, each sending approximately 7.8 billion spam emails daily.
- People unsubscribe when emails look spammy (28%), feel irrelevant (40%), or arrive too often (27%).
- 48% of marketers report that staying out of spam folders is a major challenge; repeated misses make 52.7% of consumers feel annoyed, lose trust, or opt out.
- In 2024, Yahoo and Google capped spam complaints at 0.3%.
- As of 2025, the most common spam email topics were prizes or giveaways (36.7%), job opportunities (36.3%), and banking messages (34.6%).
Conclusion
Email statistics help businesses improve their email marketing and measure performance using metrics such as delivery, opens, clicks, bounces, and unsubscribes. By regularly monitoring, email marketers can understand consumer preferences, identify problems, and address weaknesses.
This article enables better decisions regarding subject lines, content, timing, and audience selection. With regular testing and incremental updates, campaigns can perform better over time. Overall, the email statistics article will provide an effective analysis to track and help ensure messages reach the appropriate recipients.