
Introduction
Electric Vehicle Statistics: In recent years, electric vehicles (EVs) have changed the way people travel as they run on electricity rather than petrol or diesel, making them cleaner and safer for the environment. EVs eliminate tailpipe emissions, significantly mitigating urban air pollution and improving public health outcomes. More people are choosing EVs as fuel prices rise and the population grows. Better technology and more charging stations are also making them easier and more convenient to use every day. Many governments are also supporting their use. As a result, electric vehicles are becoming increasingly popular and leading us toward a greener, smarter future.
Editor’s Choice
- In 2026, the global electric vehicle market is expected to generate USD 996.3 billion in revenue.
- Statista reports a 15% contraction in U.S. EV sales for 2026. Revenue is projected closer to USD 98.4 billion.
- Battery Electric Vehicles are expected to lead with a 69.8% market share.
- Lithium-ion batteries will dominate, holding 76.4% of the market by battery type.
- Vehicles with a range of 150-300 miles are projected to account for 58.7 % of sales.
- North America is set to lead the regional market with a 42% share.
- As of 2026, passenger light-duty BEVs (PLDVs-BEV) lead with 75.3 million vehicles globally.
- Passenger EV sales growth is expected to slow to 12% in 2026.
- By 2030, electric vehicles (EVs) are expected to make up about 30% of all new car sales worldwide.
- Electric Vehicle ownership is highest among 25-34-year-olds, at 65%.
- Tesla remains the most valuable EV company and reclaimed the #1 BEV spot in Q1 2026.
- In 2026, the total global electric vehicle charging infrastructure market is expected to reach USD 52.3 billion.
Electric Vehicle Market Size
- According to Statista, the global electric vehicle market is expected to generate USD 996.3 billion in revenue in 2026.
- The market is projected to grow steadily at a compound annual growth rate of 2.88 % between 2026 and 2030.
- By 2030, the EV market revenue is expected to reach USD 1.1 trillion.
- Unit sales of electric vehicles are forecast to reach 30.03 million by 2030.
- China is set to lead the market in revenue, generating an estimated USD 533 billion in 2026.
Electric Car Market Statistics By Vehicle Type

(Reference: coherentmarketinsights.com)
- Battery Electric Vehicles (BEVs) lead the market with a 69.8% share, making them the dominant type of electric car.
- Plug-in Hybrid Electric Vehicles account for 18.5%, and Hybrid Electric Vehicles represent 11.7%.
By Battery Type

(Reference: coherentmarketinsights.com)
- Lithium-ion batteries dominate the electric car market, holding 76.4% market share.
- Nickel-Metal Hydride batteries account for 15.2%, while Solid-State batteries make up 8.4%.
Electric Vehicle Market In The United States
- Statista reports a 15% contraction in U.S. EV sales for 2026. Revenue is projected closer to USD 98.4 billion.
- From 2026 to 2030, the market is expected to grow at an average annual rate (CAGR) of 8.58 %.
- By 2030, the EV market revenue is projected to reach USD 159.7 billion.
- Unit sales of electric vehicles in the U.S. are expected to reach 2.43 million.
Global Electric Vehicle Stock Growth
- According to IEA reports, battery electric vehicles are expected to grow from 8.6 million in 2024 to 9.6 million in 2025, 10.7 million in 2026, 12.0 million in 2027, and 13.5 million by 2028.
- Analysts expect PHEVs to reach about 3.6 million by 2028, remaining relevant during the transition.
- In the Stated Policies Scenario (STEPS), EVs (excluding two‑/three‑wheelers) grow from under 45 million in 2023 to 250 million by 2030 and 525 million by 2035, so over 25% of vehicles are electric by 2035, averaging 23 % annual growth.
- In the Announced Pledges Scenario (APS), EV stock (excl. 2/3Ws) hits 585 million in 2035, about 10 % more than STEPS, representing 30 % of the fleet and averaging 24 % yearly growth.
- In the Net Zero Emissions Scenario (NZE), EV numbers rise fastest, reaching 790 million in 2035 at a 27% annual growth rate.
Stock Mode Growth In IEA Scenarios

(Source: iea.org)
- As of 2026, passenger light-duty BEVs (PLDVs-BEV) lead with 75.3 million vehicles globally.
- Passenger light-duty PHEVs (PLDVs-PHEV) follow, at 26.9 million vehicles.
- Light commercial BEVs contribute 3.9 million vehicles, while light commercial PHEVs reach 0.3 million vehicles.
- Among heavy vehicles, buses-BEV total 1.4 million, and buses-PHEV are about 0.1 million.
- For trucks, BEVs stand at 1.0 million and PHEVs at 0.1 million, indicating early growth in commercial electrification.
Stock Mode Growth In STEPS Scenario
- Passenger light‑duty BEVs (PLDVs-BEV) lead with 72.2 million vehicles.
- Plug‑in hybrid PLDVs (PHEVs) total 29.2 million vehicles, showing slower growth.
- Light commercial BEVs (LCVs-BEV) reach 3.7 million vehicles, while LCVs-PHEV are 0.2 million vehicles.
- Battery electric buses (Buses-BEV) expand to 1.3 million vehicles, and plug‑in hybrid buses (Buses-PHEV) are about 0.1 million vehicles.
- Battery electric trucks (Trucks-BEV) reach 0.9 million vehicles.
Electric Vehicle User Demographics
- Electric Vehicle ownership is highest among 25-34-year-olds, with 65% owning an EV, according to coxautoinc.eu.
- Ownership is 57% for 35-44-year-olds and 48% for 18-24-year-olds.
- Consumer Affairs further stated that in the U.S., 56% of Democrats plan to make their next vehicle an EV.
- Among U.S. adults aged 18-29, 48% intend to choose an EV.
- Gender data in the U.S. reveals that men make up 67% of EV buyers versus 33% women.
- Younger, urban, and politically aligned consumers remain the most likely to adopt EVs in 2026.
Global EV Sales Growth Statistics
- According to Bloomberg, passenger EV sales growth is expected to slow to 12% in 2026, including battery-electric and plug-in hybrid vehicles.
- China’s passenger EV sales reached around 15.6 million in 2025, with an increase of 27%, with 2026 growth projected at 13%.
- U.S. battery prices fell 8% in 2025, improving EV affordability despite higher new car costs.
- GM faces USD 1.6 billion in charges from reducing EV production capacity.

(Source: iea.org)
- In the Stated Policies Scenario (STEPS), global EV sales (excluding 2/3Ws) reach about 45 million in 2030 and 64 million in 2035, with China the largest market at 19.1 million vehicles.
- Under the Announced Pledges Scenario (APS), sales climb to nearly 49.3 million by 2030 and about 79 million by 2035.
- In the Net Zero Emissions by 2050 (NZE) Scenario, EV sales need to reach around 70.4 million in 2030 and over 103.7 million in 2035.
By Region
- According to Coherent Market Insights, by 2030, electric vehicles (EVs) are expected to make up about 30% of all new car sales worldwide.
- Europe will lead with 35% (Norway >90 %), followed by the United States (20%), South Korea (20%), Japan (15%), and India (5%).
- Major companies leading the push toward electric vehicle adoption include Tesla, GM, Ford, and Rivian in the United States; Volkswagen, BMW, Mercedes-Benz, Renault, and Volvo in Europe; Toyota, Nissan, and Honda in Japan; Hyundai, Kia, LG Energy Solution, and Samsung SDI in South Korea; and Tata Motors, Mahindra, and Maruti Suzuki in India.
Projected Global Electric Vehicle Adoption Statistics
| Vehicle Type/Segment | 2030 Sales/Stock | 2035 Sales/Stock | Share/Notes |
| Light-Duty Vehicles (LDVs) | Sales: 43 million Stock: 245 million | Sales: 60 million Stock: 505 million | Sales Share: 40% (2030), 55% (2035) Approximately 1 in 3 LDVs is electric |
| Sales: 47 million Stock: 565 million | Sales: 75 million | Sales Share: Approximately 67% (2035) 525 million PLDVs, 7% LCVs | |
| China (LDVs) | 40% of global sales | Global share declines from 60% in 2023 | |
| United States (LDVs) | 20% of global sales | Share nearly doubles by 2030 | |
| Europe (LDVs) | Stable | 25% of global sales | |
| Two/Three-Wheelers (2/3Ws) | Stock: 210 million | Stock: 360 million | >1/3 of 2/3W fleet electric |
| Two/Three-Wheelers (2/3Ws) | Stock: 430 million | – | 40% of 2/3Ws electric |
| Electric 2/3W Sales Share | – | 60% (2035) | |
| Electric 2/3W Sales Share | – | 75% (2035) | |
Top Global EV Manufacturers Statistics
BYD (Build Your Dreams), China
- BYD became the world’s largest new energy vehicle (NEV) maker and the top battery electric vehicle (BEV) seller in 2025, surpassing Tesla.
- It sold about 2.26 million BEVs in 2025, up 27% to 28% year-over-year, and 4.54-4.6 million total NEVs, including plug-in hybrids (PHEVs).
- In Q1 2026, BEV sales dropped 25% YoY to 310,389 units due to subsidy changes in China, while total NEVs reached 700,463 units.
- BYD plans to export 1.5 million units overseas in 2026, after exporting 1.05 million units in 2025 (+150% YoY).
- In the UK, Q1 2026 registrations reached a record 21,337, with March alone at 15,162 units (+134% YoY).
- BYD’s vertical integration, including self-produced Blade Battery cells, supports cost efficiency and strong supply chains.
Tesla, United States
- Tesla remains the most valuable EV company and reclaimed the #1 BEV spot in Q1 2026.
- It delivered 1,636,129 vehicles in 2025, down 8.6% YoY.
- Q1 2026 deliveries were 358,023 units (+6.3% YoY) but down 14.4%, with production at 408,386 vehicles.
- Tesla holds 45% of U.S. EV sales in 2026.
Geely Holding Group, China
- Geely sold 3,024,567 vehicles in 2025 (+39% YoY), including 1,687,767 NEVs (+90% YoY).
- Sub-brands Zeekr and Lynk & Co showed strong growth.
- In 2026, the market targeted up to 3.45 million vehicles in total, including 2.22 million NEVs.
Volkswagen Group, Germany
- VW sold almost 983,000 BEVs in 2025 (+32% YoY).
- Audi, SEAT/Cupra, and Porsche contributed significant growth.
- Europe remains its strongest market.
Hyundai Motor Company, South Korea
- On the other side, Hyundai sold around 269,169 BEVs in 2025 (+17% YoY) and 932,123 total electrified vehicles (+27% YoY).
- Hybrid sales were 611,783 units (+32% YoY). Key markets include the US and India, with support from flexible powertrains.
Global EV Charging Infrastructure Market Statistics
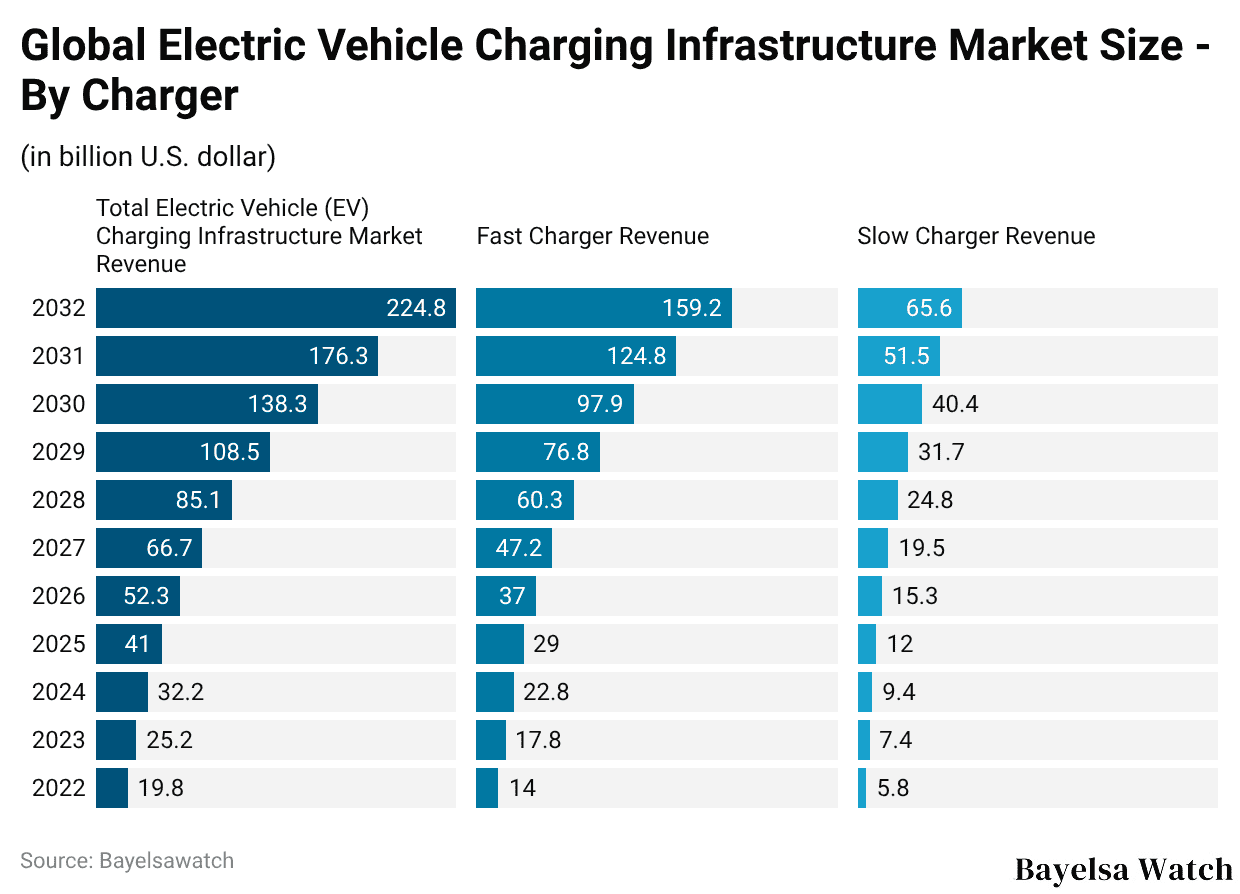
(Reference: market.us)
- In 2026, the total global electric vehicle charging infrastructure market is expected to reach USD 52.3 billion.
- Moreover, fast chargers are forecast to generate USD 37.0 billion in revenue, followed by slow chargers, which are expected to generate USD 15.3 billion.
By Application
- Commercial EV charging dominates at 63.40%, serving public places such as malls, workplaces, parking lots, and highways.
- Residential charging holds 36.60%, enabling convenient overnight home charging for EV owners.
Electric Vehicle Charging Stations Per 100 Kilometers Of Paved Road
| Country/Region | Charging Stations per 100 km |
| Netherlands | 19.3 |
| China | 3.5 |
| United Kingdom | 3.1 |
| Germany | 2.8 |
| UAE | 2.5 |
| Japan | 2.3 |
| Singapore | 2.2 |
| South Korea | 2.0 |
| Sweden | 1.9 |
| France | 1.5 |
| United States | 0.9 |
| Russia | 0.1 |
Average Revenue Per EV Charging Station

(Reference: market.us)
- In 2026, the average revenue per electric vehicle charging station is projected to be about USD 3,020.
- In 2027, revenue per charging station will reach around USD 3,500, rising to USD 4,030 by 2028.
Key Sustainable Initiatives
- The ET Autotech report stated that battery‑electric vehicles are expected to represent 23% of new car sales in the EU and Norway in 2026, rising from 19% in 2025, backing climate goals.
- The UK’s Zero Emission Vehicle mandate aims for 28% of new car registrations to be electric in 2026, increasing to 80% by 2030 and 100% by 2035 to cut transport emissions.
- As of March 31, 2026, the UK has reached 119,080 public chargers.
- Electrifying European corporate fleets could deliver up to EUR 246 billion in savings by 2030 and significantly reduce CO2 emissions.
- sustainableatlas.org report further stated that Life‑cycle studies show battery EVs emit around 58%-73 % less greenhouse gases than petrol cars, avoiding about 1-2 tonnes of CO2 per EV yearly in the UK.
Conclusion
Electric vehicles are a cleaner and better way to travel. They reduce pollution and use less fossil fuel. EVs also save energy and help protect the environment. Some problems, such as charging stations and battery costs, still exist, but they are improving with new technology. Many people and governments now support EVs. In the future, electric vehicles will play an important role in making transportation more eco-friendly and sustainable.
FAQ
Electric vehicles work by using a battery to power an electric motor that moves the vehicle.
Yes, electric vehicles are better for the environment because they produce less pollution and reduce carbon emissions.
It takes about 30 minutes to several hours to charge an electric vehicle, depending on the type of charger used.
Most electric vehicles can travel between 200 and 500 kilometers on a full charge.